neuroplot.plot.single.SinglePlot
- class neuroplot.plot.single.SinglePlot(axes: int | Sequence[int] | None = None, slices: int | Sequence[int] | None = None, transforms: Sequence[Callable[[ndarray], ndarray]] | None = None, figsize: tuple[float, float] | None = None, title: str | None = None)[source]
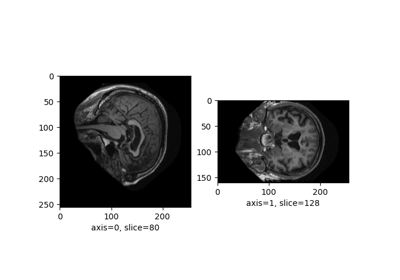
To plot a single neuroimage.
2D slices will be plotted via the method
plot(). The user can choose which anatomical axes to plot, and which slice to plot along the axes.The title of the figure can be changed between plots using
set_title().Just a random reference to Harris et al.[1]. And another to Matplotlib[2].
- Parameters:
axes (int | Sequence[int] | None, default=None) – The axis (or axes) to plot, among
0(sagittal axis),1(coronal) or2(axial). Can be passed as a single axis, or a list of axes. IfNone, the three axes will be plotted.slices (int | Sequence[int] | None, default=None) – The slice to plot for each axis. If
None, the middle slice will be plotted. Otherwise, the number of slices passed must be equal to the number of plotted axes (equal to \(3\) ifaxes=None).transforms (Sequence[Callable[[np.ndarray], np.ndarray]] | None, default=None) –
Potential transforms to apply to the image before plotting. See
neuroplot.transforms.Important
No matter the transforms passed, the image will first be reoriented to the RAS+ coordinate system.
figsize (tuple[float, float] | None, default=None) – The size of the figure. See
matplotlib.pyplot.figure()for more details.title (str | None, default=None) – A potential title for the figures that will be plotted.
- Raises:
AssertionError – If the number of slices passed is not equal to the number of plotted axes.
Examples
from neuroplot.plot.single import SinglePlot
from neuroplot.transforms import RescaleIntensity

plotter = SinglePlot(axes=[0, 2], slices=[55, 167], transforms=[RescaleIntensity()])
>>> plotter.set_title("A first image")
>>> plotter.plot("data/example_1.nii.gz")
>>> plotter.set_title("Another image")
>>> plotter.plot("data/example_2.nii.gz")
See also
neuroplot.plot.multiple.MultiplePlotTo plot multiple neuroimages in a grid of subplots.
References
- plot(img_path: str | Path, show: bool = True) Figure[source]
Builds a plot of an image.
- Parameters:
img_path (Union[str, Path]) – The path to the image to plot.
show (bool, default=True) – Whether to display the figure.
- Returns:
matplotlib.figure.Figure – The figure with the desired 2D slices.
- Raises:
IndexError – If a slice passed in
slicesis out of bounds in this image.